
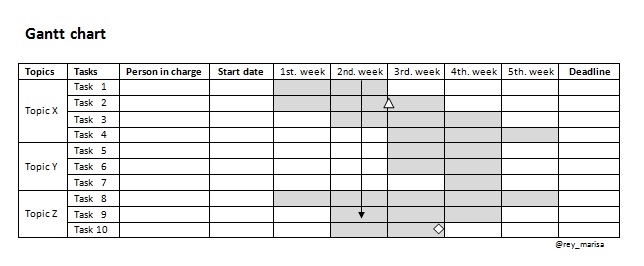
The Gantt chart is a useful tool to visualize terms of implementation of actions which have specified in the minutes (action minutes) and particularly advisable to track tasks in a project. If company does not has a specific software, you can make one with Excel, with the following guidelines:
- Make a list of topics and tasks of each of the topics.
- Detail sequential tasks that depend on each other
- Detail of parallel tasks that can be doing at the same time as the others.
- Topics and tasks organized by start date and deadline.
- Specify the person in charge for each of the actions or tasks.
- On review, mark, for example an arrow, to know at what point you are.
- Put a milestone marked as a triangle or diamond, for those key moments that have to be prepared.
The Gantt chart will help us to monitor all work very effectively.

[…] Deadline which will be advisable to link it with a Gantt chart. […]
LikeLike
[…] Activities, tasks and schedule: General activities and sequential tasks. The schedule can be made with a timeline or Gantt chart. […]
LikeLike
[…] the Gantt chart to follow up action deadlines recorded a meeting […]
LikeLike
[…] important to write short minutes. If it possible in only one page, with a follow-up reflected in a Gantt chart to specify […]
LikeLike
[…] helps a lot to make a to do list and write tasks down in a Gantt chart to keep track them. Being productive, suggesting improvements, being creative, if […]
LikeLike